Output: All the output files are available to be downloaded as zip file
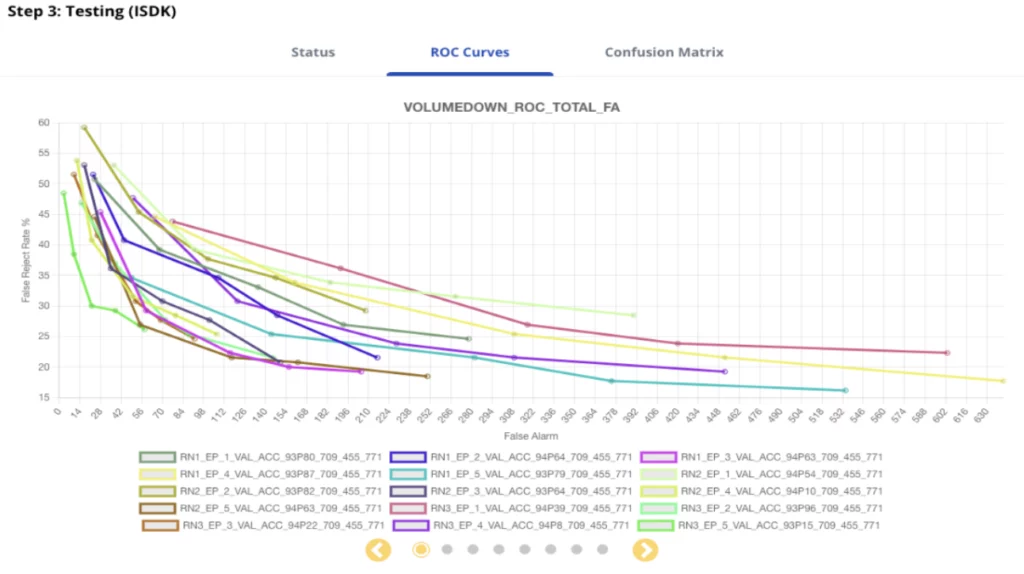
ROC Curves: View roc curves for each class and analyze the performance of your weights.
Detection ROC curve plots will produce the False Reject Rate and False Alarm Rate of a given set of weights for 5 different operating thresholds: 0.50, 0.60, 0.70, 0.86, 0.95 which can be used to select the weights and threshold for optimal performance
ROC curve plot is interactive and can be hovered over for additional details and areas of particular interest can be zoomed in on
The ROC curve plots viewable via carousel control are:
The ROC curve per class with respect to the sum of all False Alarm’s generated by all the classes
ROC curve with respect to the False Alarm’s generated by the specific class
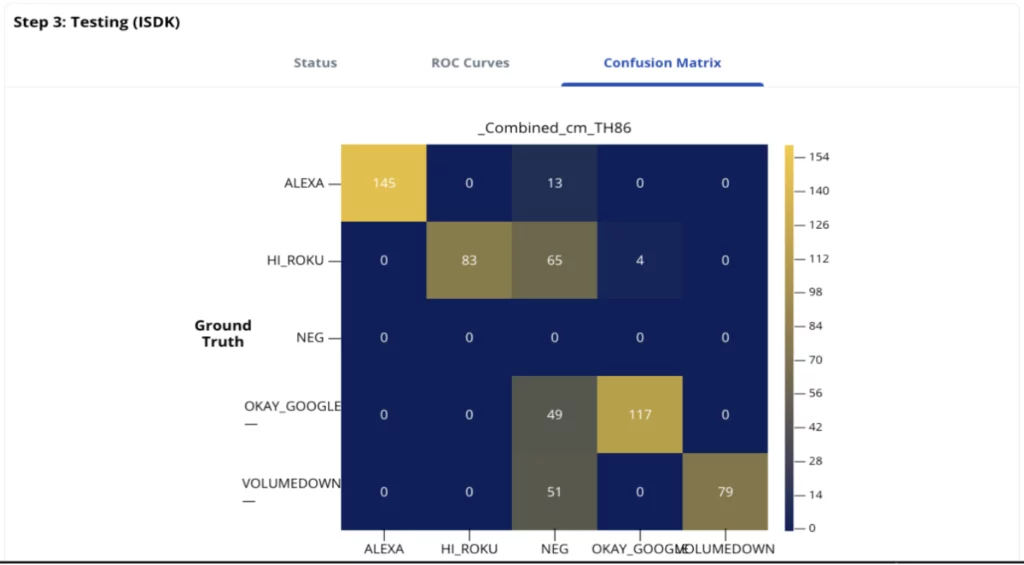
Confusion Matrices: View the confusion matrix for each bin file and analyze the performance.